From Data Silos to Smart Dashboards: A Guide for Architects
Breaking the information bottleneck in modern architectural practice through AI-driven visualization.

The Silent Profit Killer: Disconnected Platforms
In the contemporary architectural landscape, the typical firm operates on an average of five or more disconnected software platforms. From Revit for BIM and Deltek for accounting to specialized project management and RFI tracking tools, data is everywhere—yet nowhere. This fragmentation creates "data silos" that force project managers to spend hours manually compiling reports, leading to delayed decisions and reactive project management.
What is a Smart Dashboard?
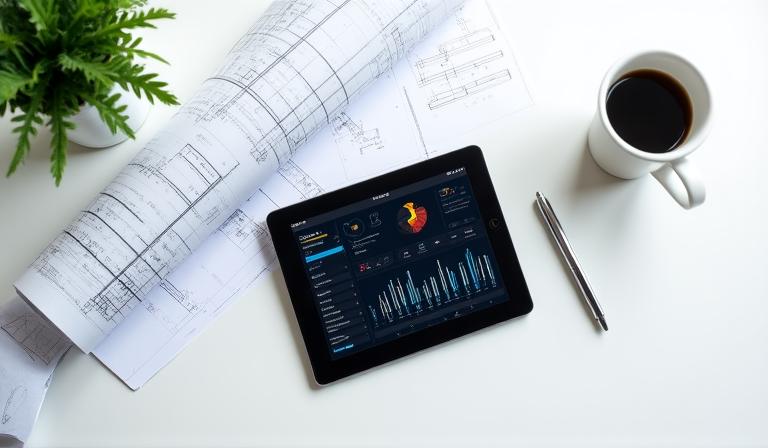
Unlike static PDF reports or manual Excel trackers, a Smart Dashboard is a live, automated ecosystem. It leverages AI to pull real-time streams from your existing tools—Revit models, financial software, and communication logs—transforming raw numbers into actionable visual intelligence. It isn't just data; it's a window into the health of your project.
5 Key Metrics to Track Globally
Design Hours vs. Contract
Real-time tracking of resource burn rates against fixed-fee milestones to prevent scope creep.
Clash Detection Velocity
How quickly are coordination conflicts being resolved within the BIM environment?
RFI Turnaround Time
Bottleneck identification for external consultants and internal reviews.
Change Order Impact
Visualizing the ripple effect of design changes on overall project timelines and budget.
Implementation: The Architronix AI Approach
Transitioning to a smart environment shouldn't disrupt your workflow. We map data through four critical stages:
-
Integration: Building secure APIs to Revit, Procore, and financial APIs.
-
Normalization: Cleaning disparate data formats into a unified structure.
-
Visualization: Crafting high-contrast dashboards utilizing blueprints-inspired aesthetics.
Ready to Unite Your Project Data?
Empower your project managers with one single source of truth and eliminate manual reporting today.
Talk to an Automation Expert